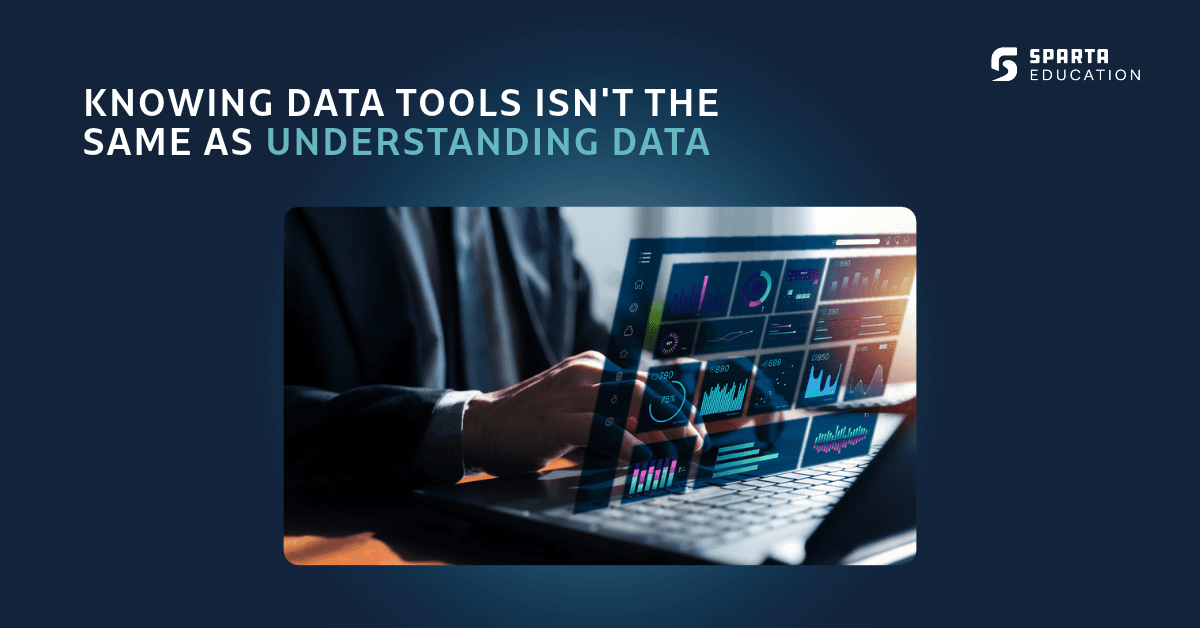
Knowing how to build a dashboard doesn't necessarily mean you know what the data is telling you.
You might be confident in Excel. You might know your way around Power BI. You might be able to write a SQL query, work in Python or produce a polished visualisation. Those are valuable skills.
But there is a difference between knowing how to use the tools of data and knowing how to think with data.
For students and graduates hoping to build careers in data and technology, that distinction matters. Because in the workplace, the goal is rarely just to produce a query, spreadsheet or dashboard.
The goal is to use data to understand something, solve something or make a better decision.
The tool is only the starting point
Technical proficiency is an important foundation.
A data analyst may need to query information using SQL, explore it using Python, work with spreadsheets and present findings through tools such as Power BI.
But imagine being given a dataset showing that customer engagement has fallen. Knowing the tools might help you calculate the size of that decline and visualise when it happened. Understanding the data requires you to go further.
- Why has engagement fallen?
- What else changed during that period?
- Is the dataset complete?
- Are you looking at the right metric?
- Could the way the data was collected affect the result?
- Does a correlation actually tell you what caused the change?
And, perhaps most importantly: what should someone do with this information?
That's where technical proficiency starts becoming business value.
Good data professionals ask better questions
Working effectively with data isn't only about finding answers. Often, it starts with questioning the information in front of you.
Imagine a dashboard shows that one product is significantly outperforming another. The easiest interpretation is that customers simply prefer that product.
But what if it was promoted more heavily? What if it was available in more locations? What if you're comparing different customer groups? What if an issue with the underlying data is distorting the picture?
The dashboard can't make those judgements for you. That requires context, curiosity and critical thinking.
For someone at the beginning of their career, developing that mindset is just as important as becoming faster with the software.
A technically correct answer isn't always a useful one
This is another important distinction. You can produce an analysis that is technically accurate but doesn't answer the problem an organisation actually needs to solve.
A stakeholder might ask for a report containing ten different metrics. A capable data professional shouldn't only think about how to produce them. They should also be thinking:
What decision is this supposed to support?
That question changes the way you approach the work. Perhaps ten metrics are unnecessary and three tell the story more clearly. Perhaps an average is hiding an important difference between groups. Perhaps the original question needs reframing altogether.
The ability to recognise that is difficult to demonstrate through knowledge of a platform alone. It comes from understanding the relationship between data, context and decisions.
AI makes this distinction even more important
AI is adding another layer to this conversation. Tools can increasingly support tasks such as writing code, generating queries, summarising information and exploring datasets.
But faster analysis isn't automatically better analysis.
If an AI tool generates a SQL query, you still need to understand whether that query is appropriate. If it identifies a pattern, you need to question whether the pattern is meaningful. If it produces an explanation, you need to assess whether that explanation is supported by the evidence.
We've made a similar point elsewhere in our thinking at Sparta Education: knowing how to use an AI tool is useful, but knowing when, why and how to use it effectively is where the greater value lies.
The same principle applies to data. As tools become more capable, understanding what sits behind the output becomes more important, not less.
Data needs communication too
Finding an insight is only part of the job. You also need to communicate it.
Imagine spending hours analysing a dataset, identifying an important pattern and producing a technically impressive model. None of that guarantees that the person making the decision will understand what you've found.
Strong data professionals need to be able to translate complexity into something useful.
- What happened?
- Why does it matter?
- How confident are we in the finding?
- What should we consider doing next?
That's where communication and data storytelling become part of technical capability rather than something separate from it.
A brilliant analysis that nobody understands has limited impact.
From learning tools to learning how to apply them
This distinction sits closely alongside how we think about learning at Sparta Education. Our aim isn't simply to help students and graduates add another technology to their skills list. We want learners to understand how technical capabilities connect to real problems and the workplace.
Across our existing approach, we've described employability as sitting at the intersection of technical capability, industry understanding and human skills. Data is a perfect example of why those three areas need to work together.
Technical capability
Helps you work with the information.
Industry and business context
Help you understand what matters.
Human skills
Critical thinking, problem-solving and communication help you turn analysis into something other people can understand and act upon.
Sparta Education's wider focus on industry-informed learning is built around connecting what learners know with where that knowledge fits, how it can be applied and why it matters.
For someone hoping to start a career in data, that's an important shift in mindset.
Don't only ask: which tools do I need to learn?
Ask: what will I be able to do with them?
Don't just show employers what you can use. Show them how you think.
When you're preparing for your first data or technology role, knowing SQL, Python, Excel or Power BI can help demonstrate your technical foundations. But your projects, portfolio and interviews are also opportunities to demonstrate something deeper.
When presenting a project, don't stop at: “I created this dashboard in Power BI.”
Explain the problem you were investigating. Explain why you selected particular metrics. Talk about a pattern you noticed. Discuss a limitation in the data. Explain what you would investigate next. Show the thinking behind the tool.
Because tools will continue to change. AI will make some technical tasks quicker. New platforms and capabilities will emerge. But the underlying challenge remains remarkably human:
Can you take information, question it, understand what it means and use it to solve a problem?
At Sparta Education, that's the capability we believe learners should be building alongside their technical skills.
Because knowing the tools can help you work with data. But understanding data is what helps you make better decisions with it.
Learn to think with data
Explore Sparta Education's data courses and build the skills to turn analysis into decisions.